Let your AI drive the browser.
Kapture is an open-source MCP server and Chrome DevTools extension that gives any AI assistant real, reliable control of your browser. No Selenium, no chromedrivers, no headless guesswork — just the tab you're already looking at.
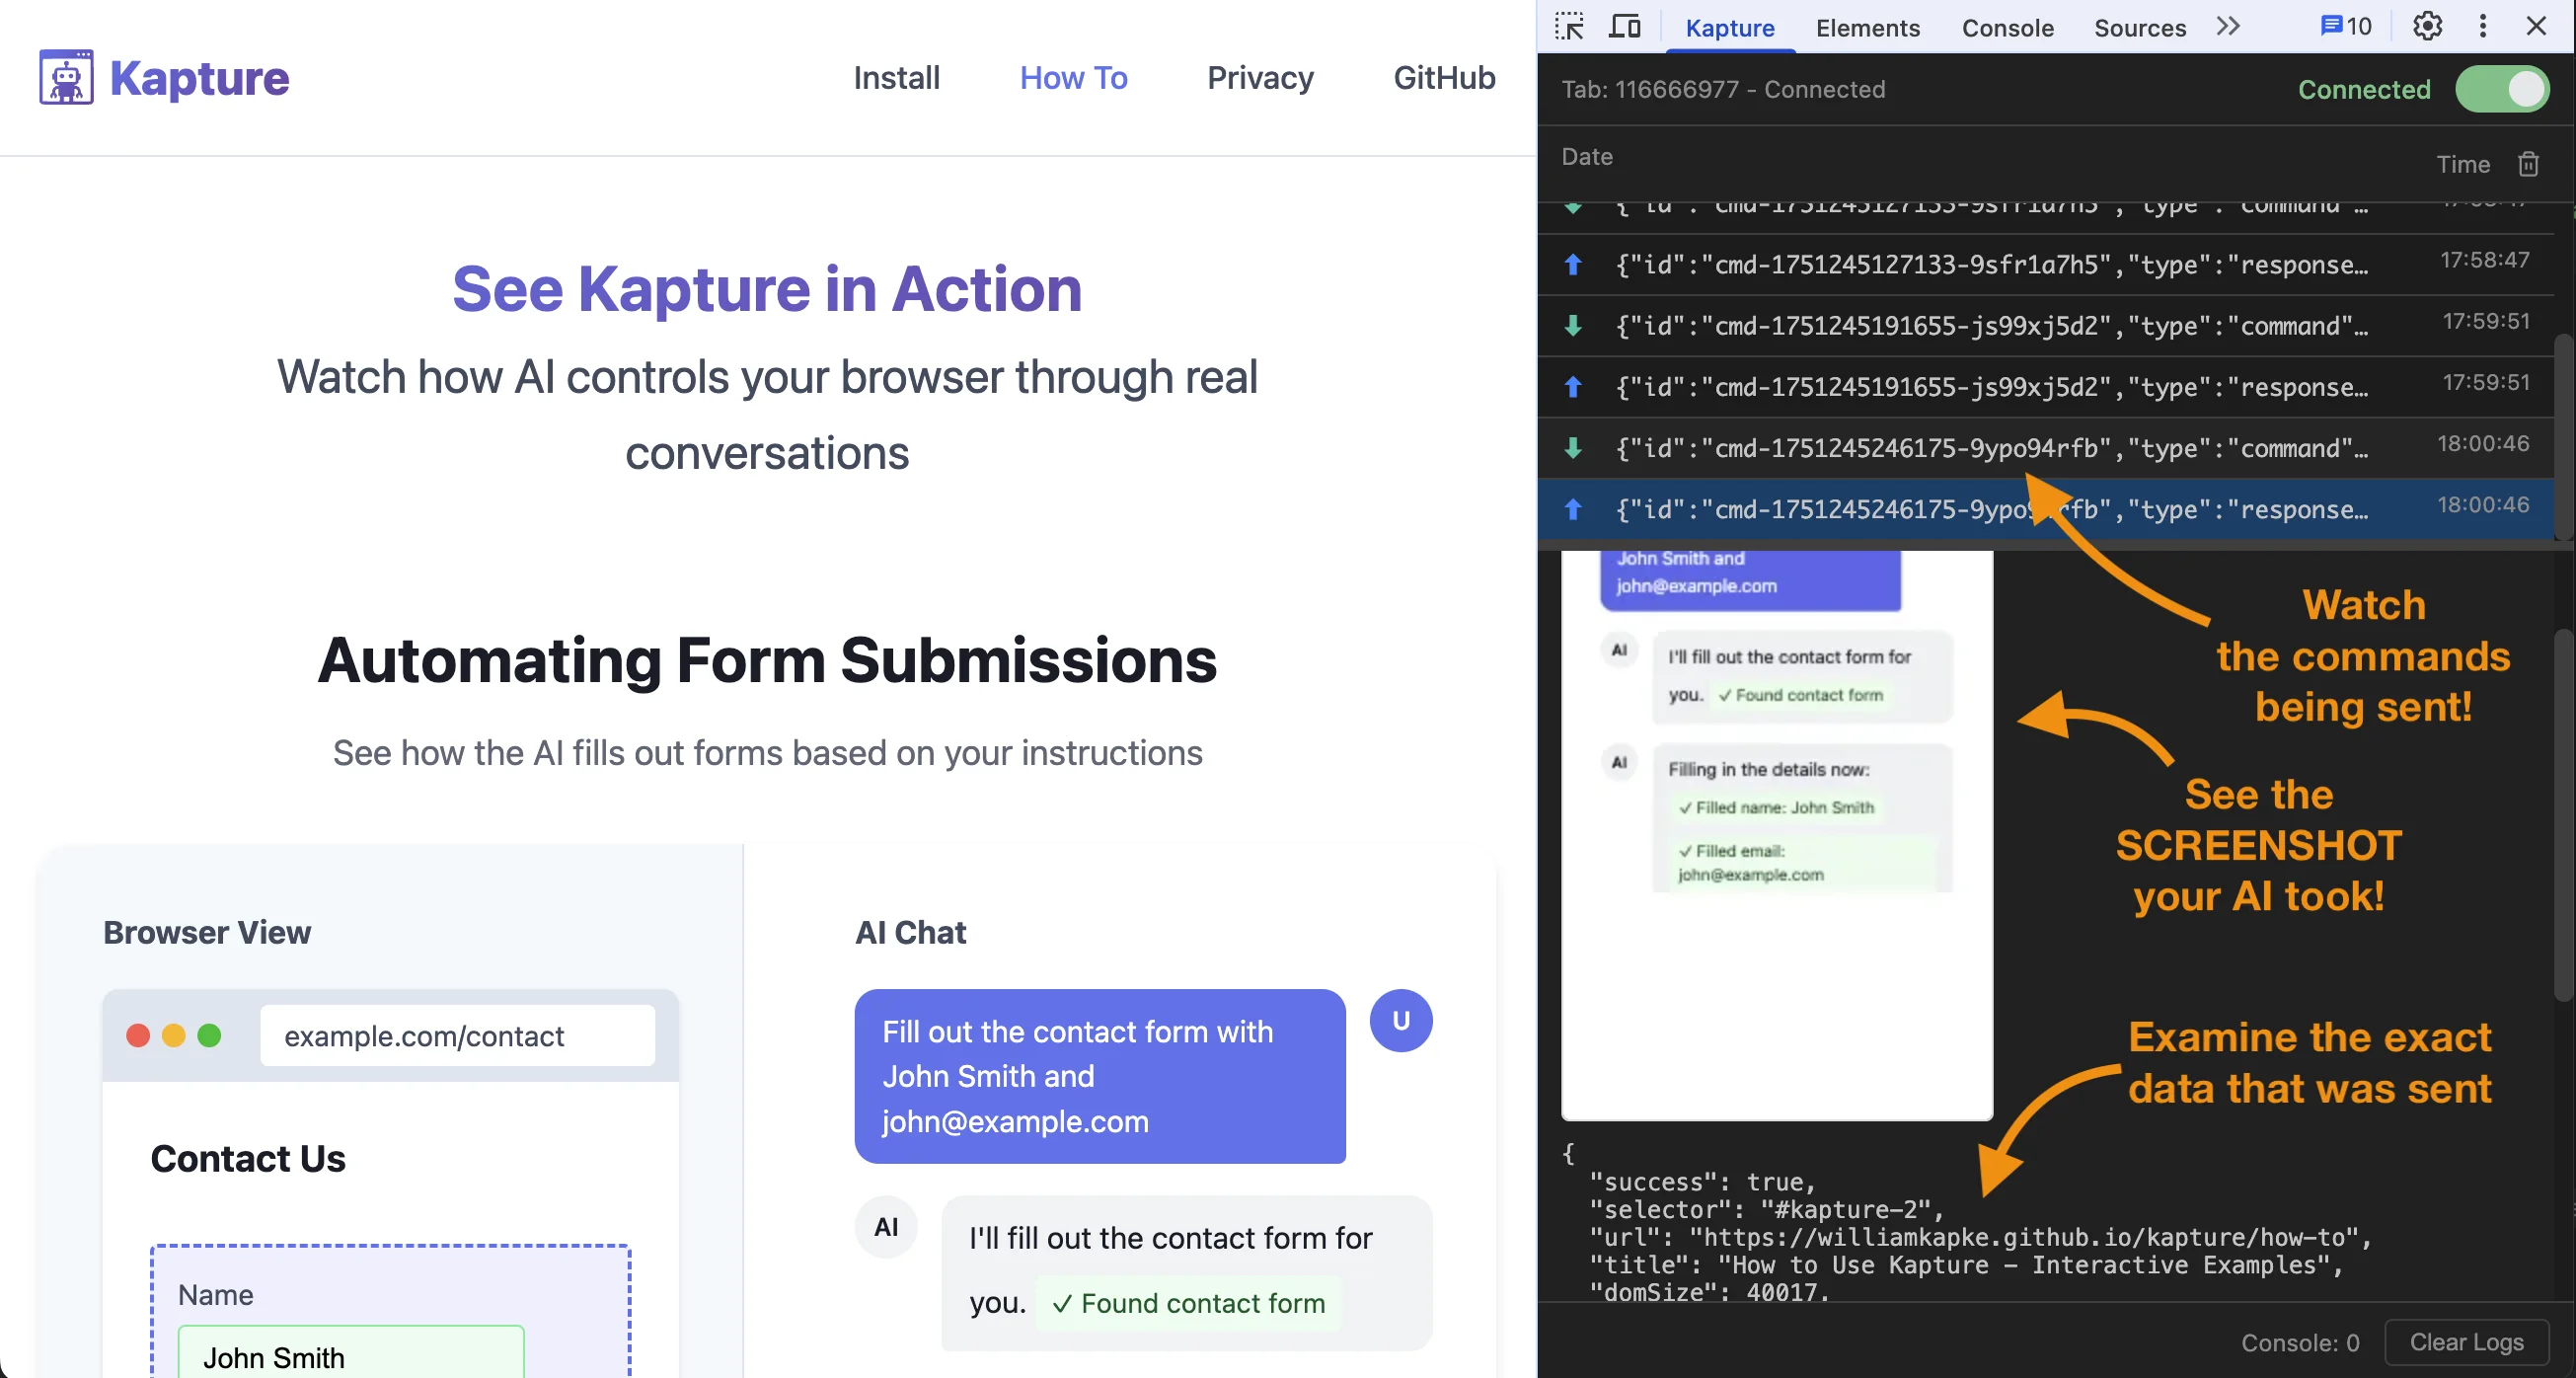
A DevTools panel that shows its work.
Every command and response is visible, timed, and inspectable — so you (and your AI) always know exactly what's happening.
Real-time command history
See every command sent and response received, with detailed timing for each round trip.
WebSocket connection status
Monitor connection health and tab registration at a glance — no silent disconnects.
Visual response preview
Screenshots render as clickable images, with the full JSON payload right beside them.
Browser detection
Automatically detects Chrome, Edge, Brave, Opera, and Vivaldi installs on your machine.
XPath & CSS selectors
Every element tool accepts both CSS selectors and XPath expressions interchangeably.
Browser selection
Open new tabs in a specific browser, or just fall back to the system default.
Everything your AI can reach.
Complete browser automation through the Model Context Protocol — tools, resources, and plain HTTP endpoints for debugging.
Navigation & Tabs
9Interaction
14Information
6Network
3Tab Management
kapture://tabs
kapture://tab/{tabId}
List all connected tabs, or get the full detail for a single one.
Console Logs
kapture://tab/{tabId}/console
Paginate with ?before={ts}&limit={n}, filter by ?level=. Max 500 per page; returns a nextCursor.
Screenshots
kapture://tab/{tabId}/screenshot
Options: ?selector={css}, ?scale=0.1–1.0, ?format=webp|jpeg|png.
Element Inspection
kapture://tab/{tabId}/elementsFromPoint
Pass ?x=&y= to get the full element stack with selectors, bounds, and styles.
DOM Access
kapture://tab/{tabId}/dom
Returns outerHTML for the page or a single element via ?selector={css}.
Element Queries
kapture://tab/{tabId}/elements
Query all matches with ?selector={css}&visible={true|false|all}.
Data Endpoints
//tabs/tab/{tabId}/tab/{tabId}/console/tab/{tabId}/dom/tab/{tabId}/elementsImage Endpoints
/tab/{tabId}/screenshot/tab/{tabId}/screenshot/view/tab/{tabId}/elementsFromPointJSON with base64 data, a direct image file for embedding, and the element stack at any point.
Navigation & Interaction (POST)
/tab/{tabId}/navigate/tab/{tabId}/back/tab/{tabId}/forward/tab/{tabId}/reload/tab/{tabId}/show/tab/{tabId}/click/tab/{tabId}/hover/tab/{tabId}/focus/tab/{tabId}/blurInput, scroll & advanced (POST)
/tab/{tabId}/fill/tab/{tabId}/select/tab/{tabId}/keypress/tab/{tabId}/type/tab/{tabId}/insertText/tab/{tabId}/clear/tab/{tabId}/scroll/tab/{tabId}/evaluate/tab/{tabId}/composeNetwork monitoring (POST)
/tab/{tabId}/network_monitor/tab/{tabId}/network_requests/tab/{tabId}/network_bodyToggle capture, then read the request list and pull individual response bodies — same JSON shapes as the MCP tools.
Tabs & debugging
/tabs/tab/{tabId}Open or close a tab. Hit any endpoint straight from your browser or curl to see exactly what your AI sees — no MCP client required.
Browser automation, without the baggage.
Existing tools work — until they don't. Kapture was built from the ground up to fix the things that make AI browser control brittle.
Other solutions
Kapture
A three-layer architecture, built for reliability.
AI applications talk MCP to the Kapture server, which speaks WebSockets to the browser extension and its DevTools panel.
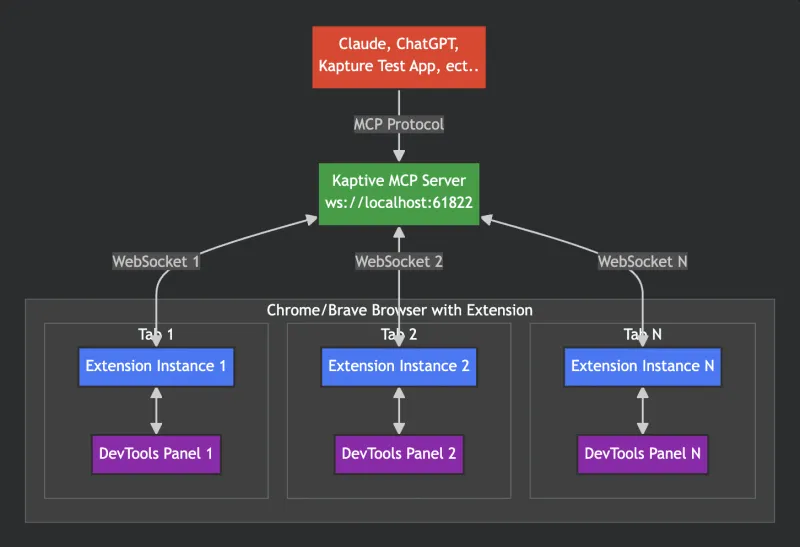
Each layer owns its responsibilities independently.
Failures are caught and reported clearly at every layer.
Monitor and test at any point in the stack.
Built for multiple browser connections at once.
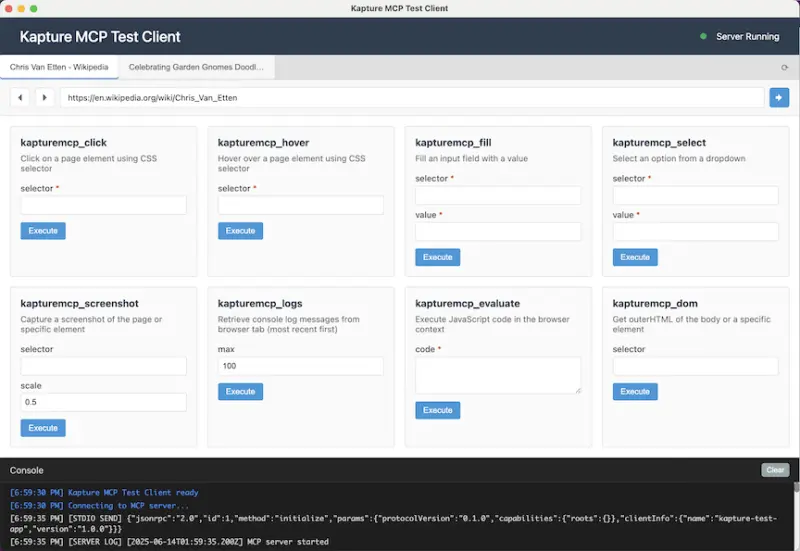
Poke at the MCP server like an AI would.
Kapture ships with an Electron test app that connects to the MCP server and lets you fire commands by hand — perfect for debugging, development, and understanding how agents will drive your setup.
- Test every MCP tool interactively
- Real-time console output
- Parameter validation
- Connection status monitoring
Ready to automate?
Give your AI the power to browse the web — in the tab you're already using.