Kapture Logo

Kapture

Built from the ground up as an MCP browser automation tool.

NEW: Run Multiple AI Assistants Simultaneously! Learn More →
100% Open Source
No Analytics
No Trackers
Install Extension View on GitHub

See Kapture in Action

A powerful DevTools extension that brings browser automation to your fingertips
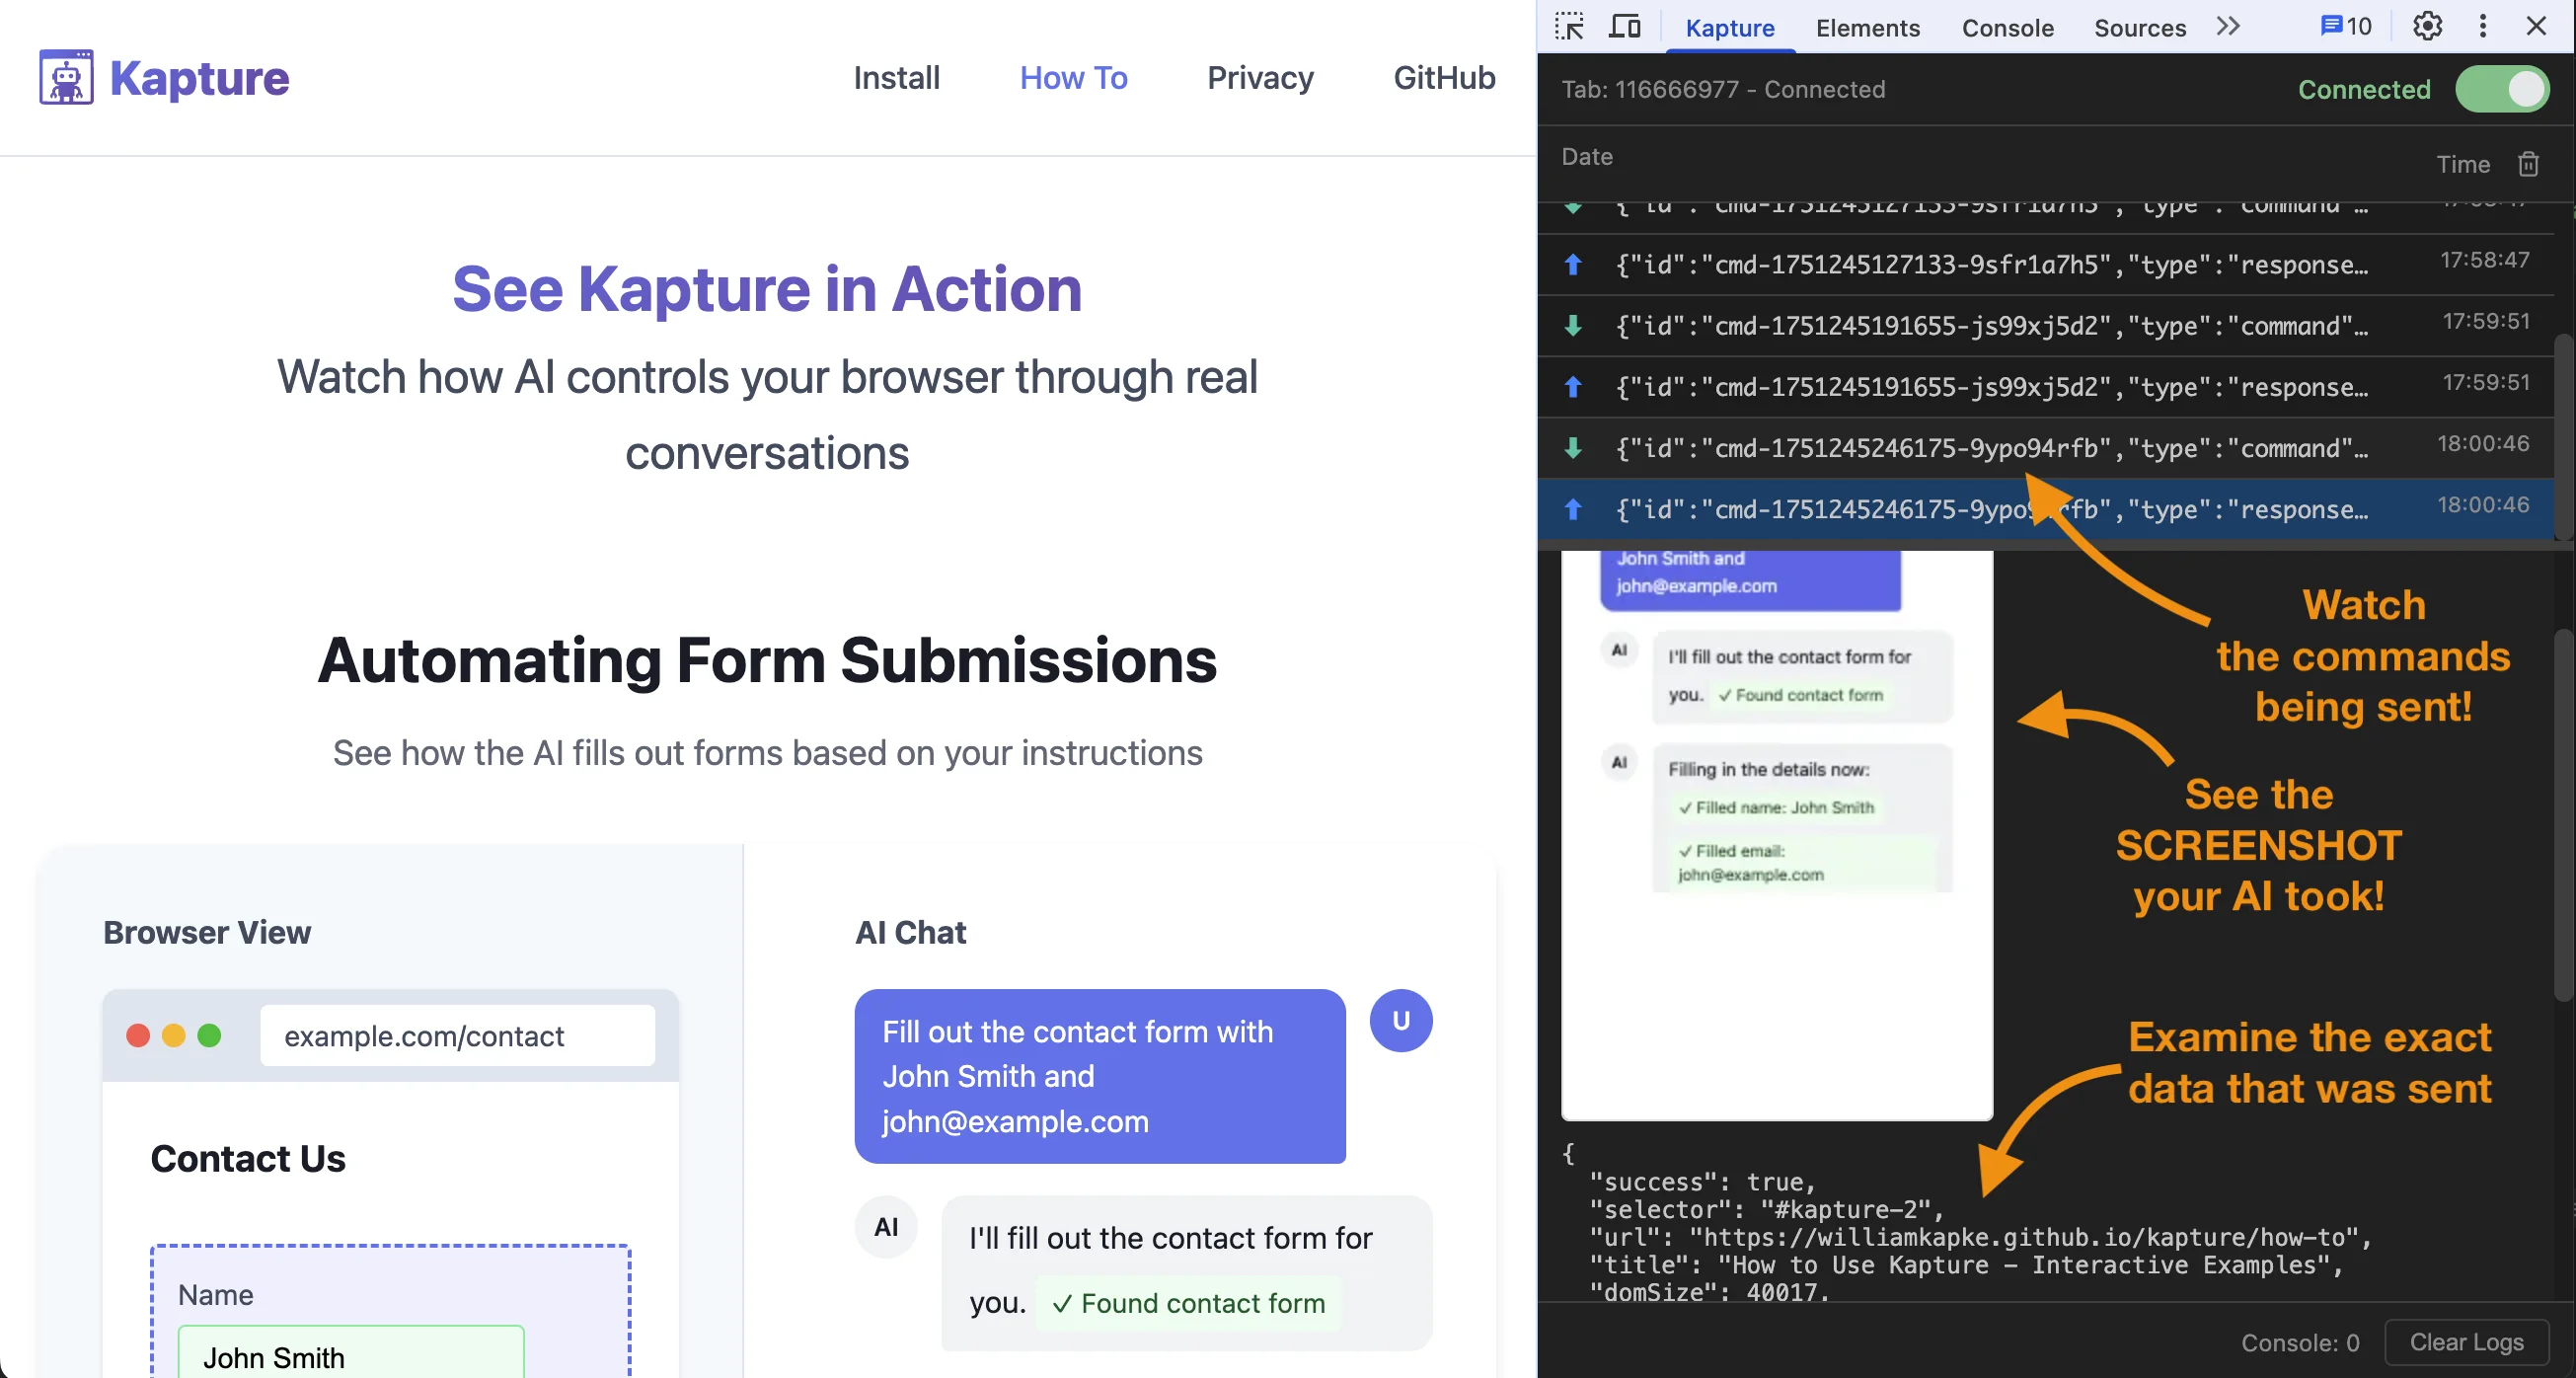
Kapture DevTools Panel showing screenshot preview, command execution, and real-time response monitoring
📊

Real-time Command History

See every command sent and response received with detailed timing information

🔌

WebSocket Connection Status

Monitor connection health and tab registration status at a glance

🖼️

Visual Response Preview

Screenshots displayed as clickable images with full JSON data in DevTools panel

🌐

Browser Detection

Automatically detects Chrome, Edge, Brave, Opera, and Vivaldi browsers

XPath Support

All element tools support both CSS selectors and XPath expressions

🚀

Browser Selection

Open new tabs in specific browsers or use system default

MCP Tools & Resources

Complete browser automation through Model Context Protocol

🛠️ MCP Tools
🧭

Navigation & Tab Management

Control browser navigation and tabs

navigate
Navigate to any URL with timeout support
back
Go back in browser history
forward
Go forward in browser history
reload
Reload the current page
list_tabs
List all connected browser tabs
tab_detail
Get detailed information about a tab
new_tab
Open new tab with browser selection
close
Close a browser tab
👆

Interaction

Interact with page elements

click
Click elements using CSS selector or XPath
hover
Hover over elements to trigger effects
fill
Fill form inputs with text values
select
Select options from HTML dropdowns
keypress
Send keyboard events with modifier support
focus
Set focus on form elements
blur
Remove focus from elements
📊

Information

Extract data from pages

screenshot
Capture page or element screenshots
dom
Get HTML content of page or elements
elements
Query elements with visibility filtering
console_logs
Retrieve browser console messages
elementsFromPoint
Get elements at specific coordinates
📚 MCP Resources
📑

Tab Management

Monitor and access browser tabs

kapture://tabs
List all connected browser tabs
kapture://tab/{tabId}
Get detailed information about a specific tab
📋

Console Logs

Access browser console output

kapture://tab/{tabId}/console
Get console logs with pagination: ?before={timestamp}&limit={count}
Filter by level: ?level={log|info|warn|error}
Max 500 logs per page • Returns nextCursor for pagination
📸

Screenshots

Capture page visuals

kapture://tab/{tabId}/screenshot
Capture with options: ?selector={css}
?scale={0.1-1.0}&format={webp|jpeg|png}
🔍

Element Inspection

Inspect page elements

kapture://tab/{tabId}/elementsFromPoint
Get all elements at coordinates: ?x={x}&y={y}
Returns element stack with selectors, bounds, and styles
🌐

DOM Access

Extract HTML content

kapture://tab/{tabId}/dom
Get HTML of page or element: ?selector={css}
Returns outerHTML for extraction and analysis
🎯

Element Queries

Query multiple elements

kapture://tab/{tabId}/elements
Query all matching elements: ?selector={css}&visible={true|false|all}
Returns array with details and select options

Direct HTTP Endpoints

Access data and images directly via HTTP for debugging and integration

Base URL: http://localhost:61822/
Extension automatically connects to server on port 61822

📊

Data Endpoints

JSON responses for data access

GET /
Server status and MCP client info
GET /tabs
List all connected browser tabs
GET /tab/{tabId}
Detailed tab information
GET /tab/{tabId}/console
Console logs with pagination
GET /tab/{tabId}/dom
HTML content of page or element
GET /tab/{tabId}/elements
Query elements by selector
🖼️

Image Endpoints

Direct image file access

GET /tab/{tabId}/screenshot
Screenshot data with base64 encoding
GET /tab/{tabId}/screenshot/view
Direct image file for viewing/embedding
GET /tab/{tabId}/elementsFromPoint
Elements at specific coordinates

What is wrong with other solutions?

Browser automation is essential, but existing solutions have critical problems

NOT Open Source

Some projects track your use and do not make the ENTIRE source code available

Single AI Limitation

Others only support one AI assistant at a time preventing parallel workflows

Complex Setup

Some solutions require Selenium, Chrome drivers, or headless browser configurations

Poor Error Handling

Cryptic errors that are difficult for AI agents to understand and recover from

Connection Issues

WebSocket disconnections and lack of reconnection support

Limited Debugging

No easy way to test commands or see what's happening

How It Works

Three-layer architecture for maximum reliability
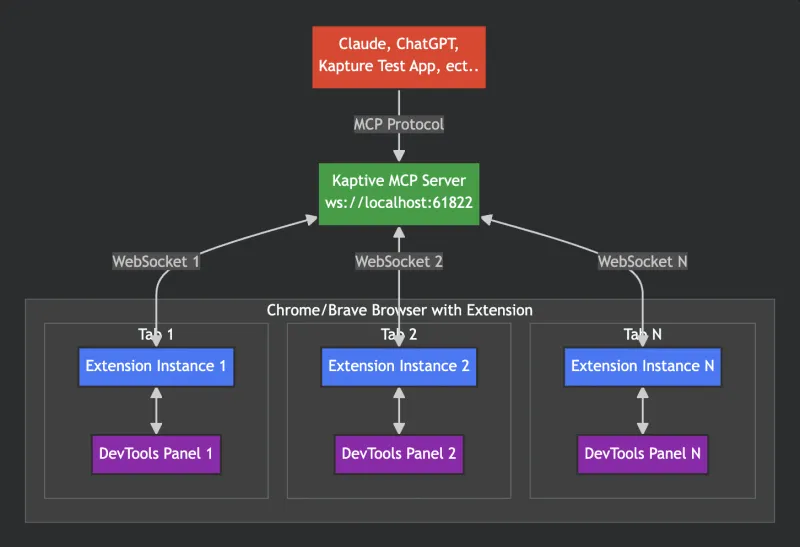
Kapture Architecture Diagram showing the flow from AI Applications through MCP Protocol to Kapture MCP Server, then via WebSockets to Chrome/Brave Browser Extensions and DevTools Panels
  • Clean Separation
    Each layer handles its responsibilities independently
  • Graceful Error Handling
    Errors are caught and reported clearly at each layer
  • Easy Debugging
    Monitor and test at any point in the stack
  • Multiple Connections
    Support for concurrent browser sessions

MCP Test Client Included

Kapture comes with a powerful Electron-based test application that lets developers connect to the MCP server and test commands as if they were an AI agent.

Perfect for debugging, development, and understanding how AI agents will interact with your browser automation setup.
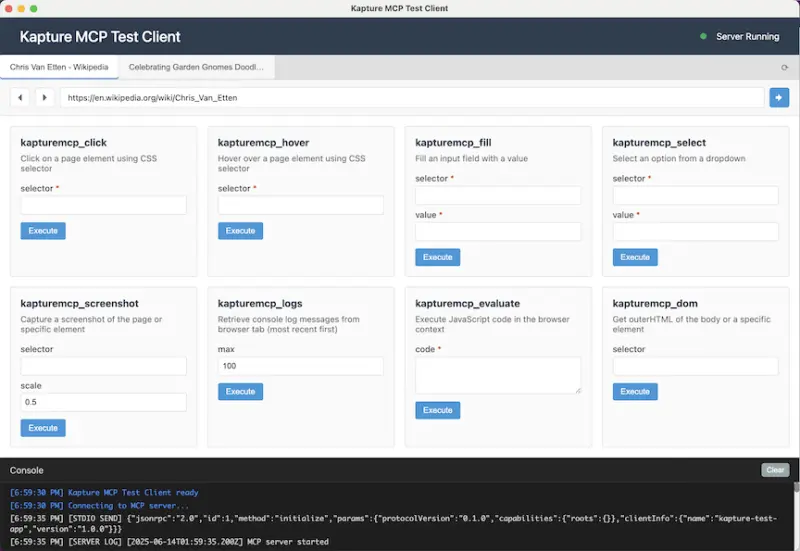
  • Test all MCP tools interactively
  • Real-time console output
  • Parameter validation
  • Connection status monitoring
Kapture MCP Test Client showing interactive tool testing interface

Ready to automate?

Give your AI the power to browse the web

Install Kapture Read Documentation